Blog · Operations
BI now starts at your sales command center
The Tailor.ia BI home page is now a sales command center. Each area is a room, each report a desk. In 3D or as a list, with the numbers up front.

Fabiano SilvaR&D Lead · · 6 min read
The Tailor.ia BI home page has a new way to see your operation: each area of your company is a room and each report is a desk inside it. You choose how to look at it: through Campus, a 3D model of your sales command center, or through List, with the same rooms as cards.
The reports are the same. What changed is the path to them: shorter, with the numbers that matter right at the entrance.
The command center in 3D
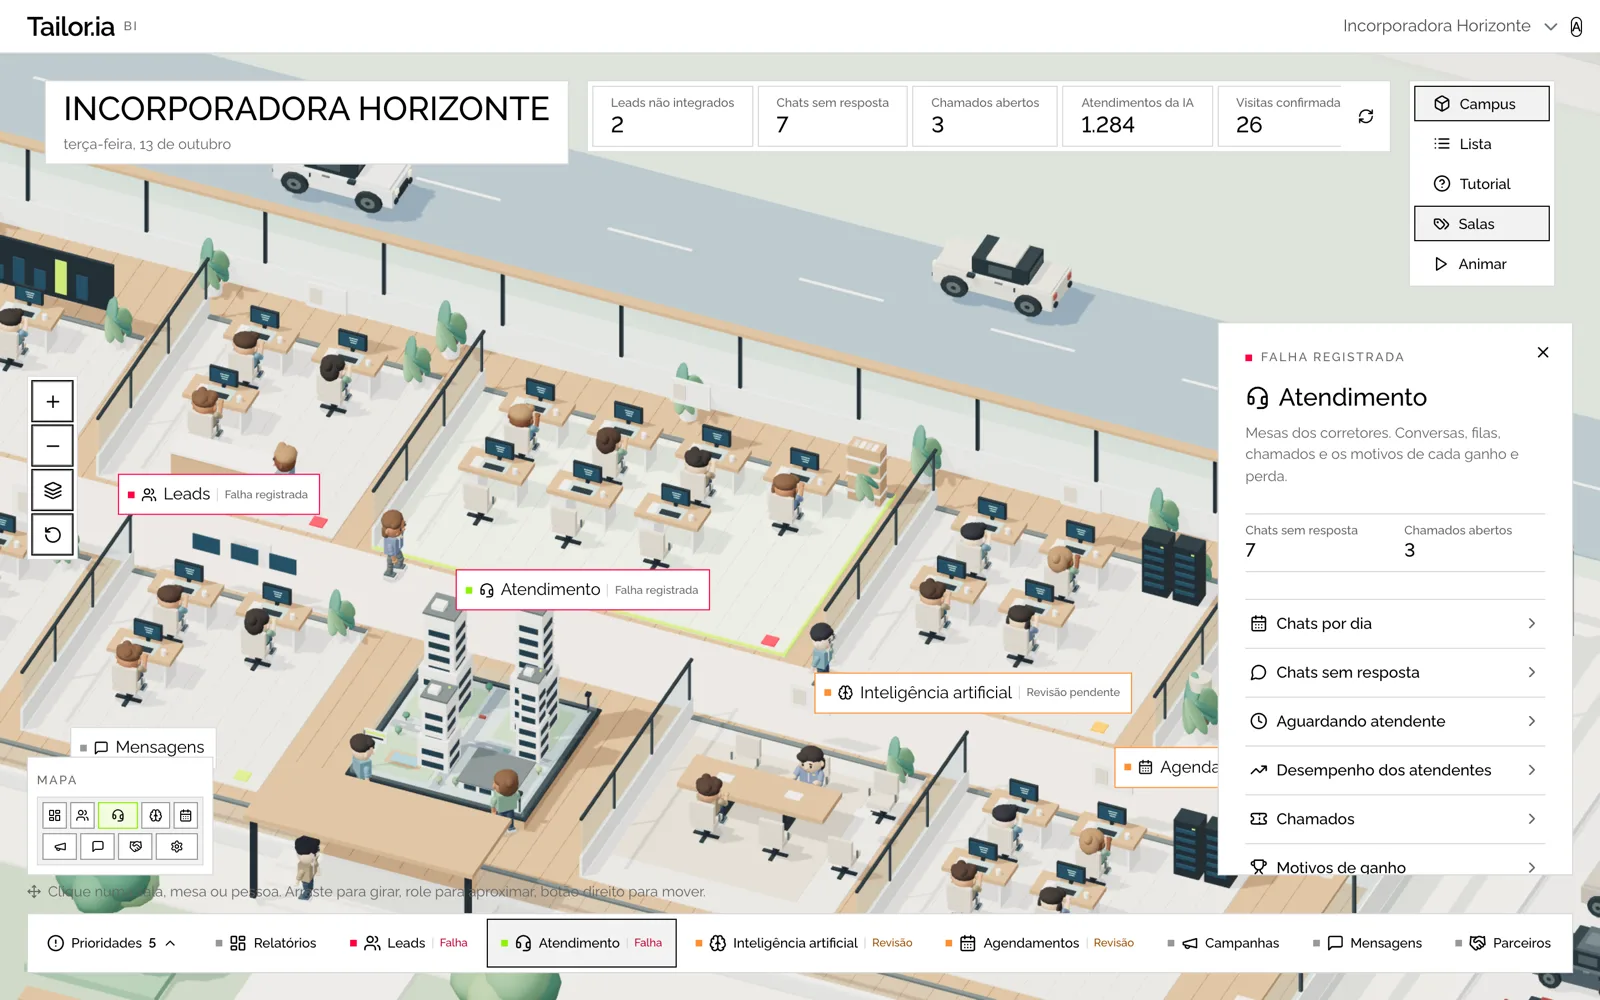
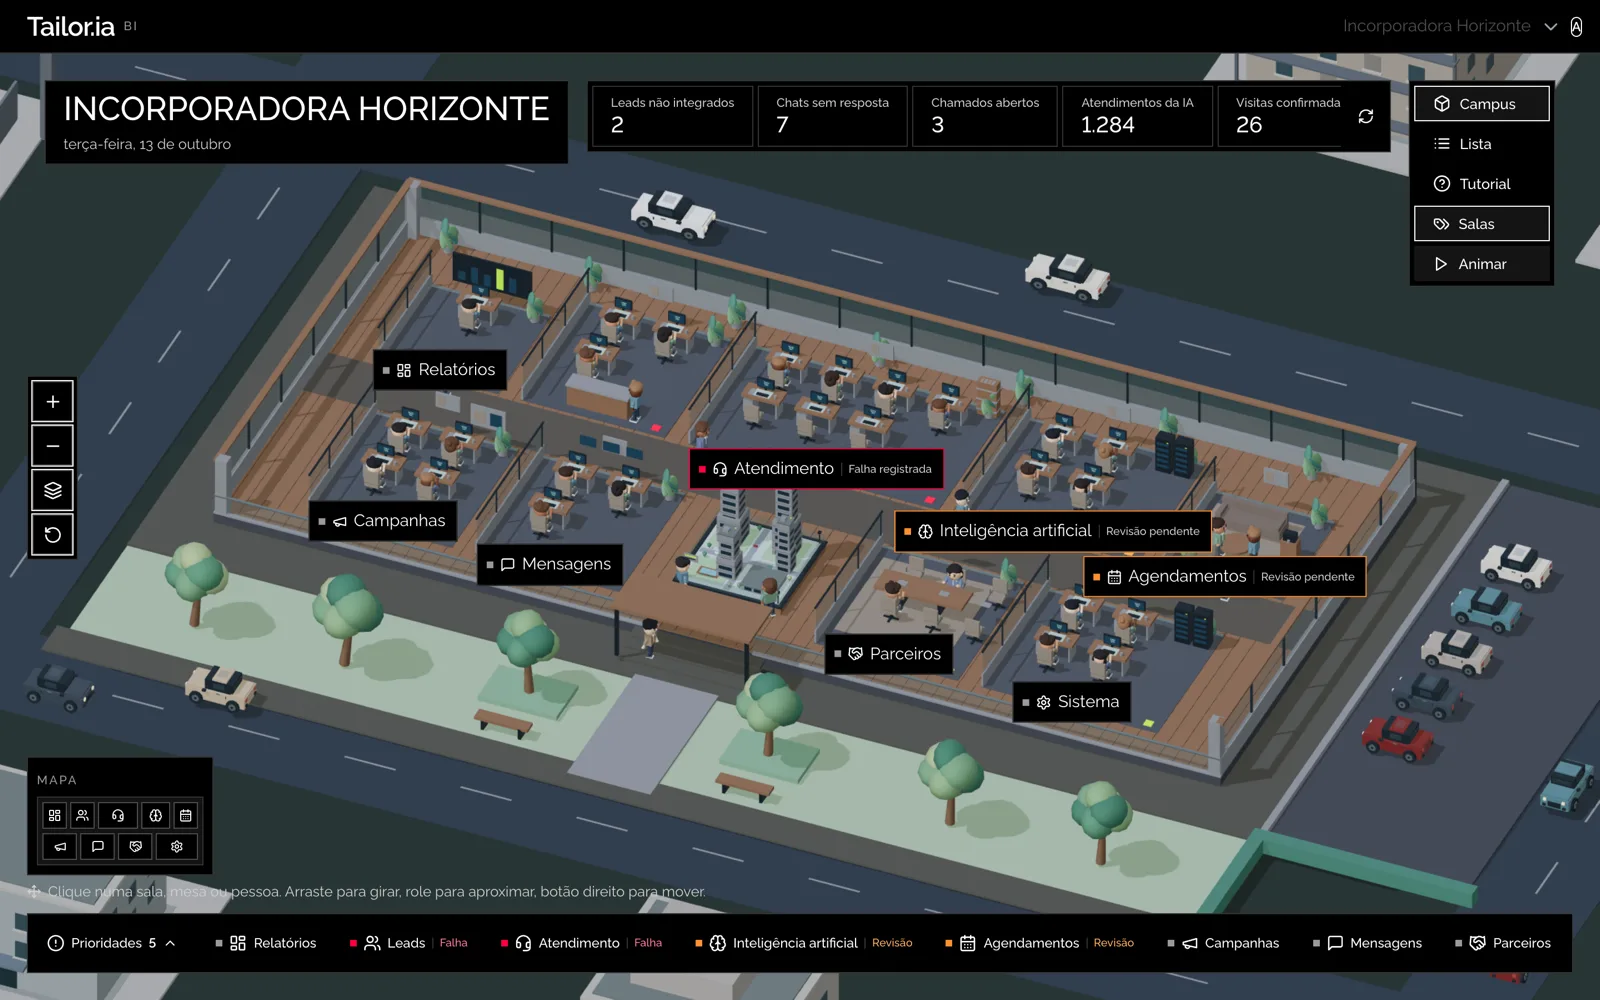
Campus is the default view on desktop. The building is your sales command center: each room is an area of the operation (Leads, Customer Service, AI and whatever else your account has), each desk is a report, and the people and cars bring the place to life. Click a room to open its details, or go straight to a desk to open the report.
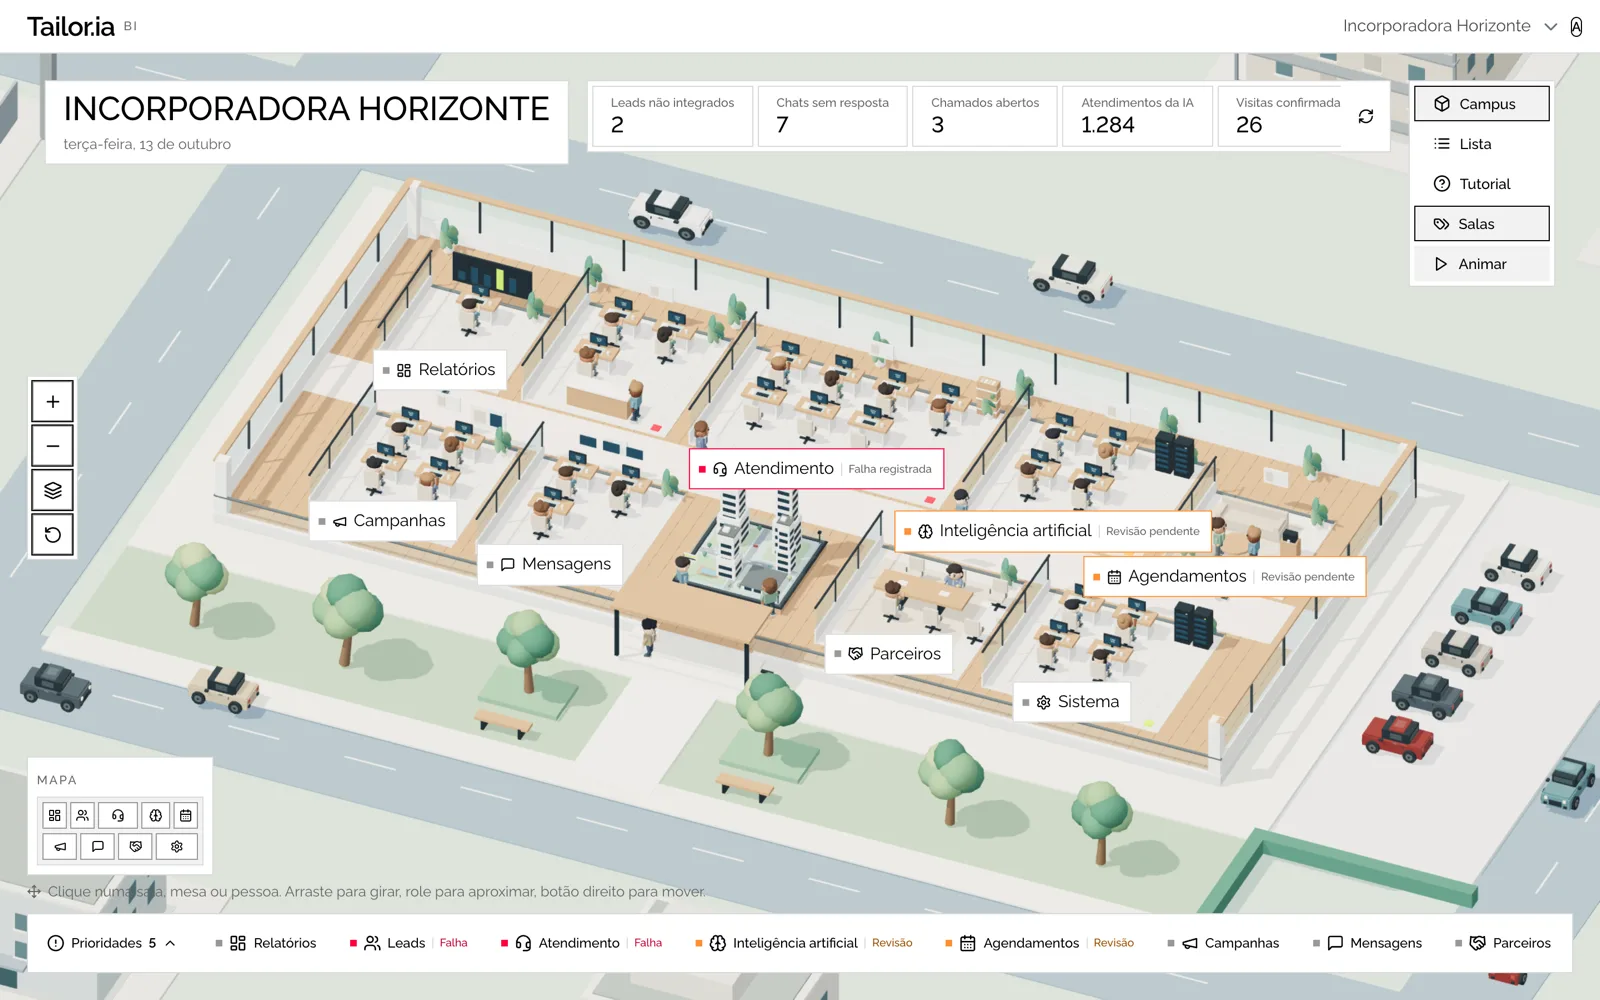
What's on the screen:
- Labels over the rooms, with a flag when something needs attention: "Failure logged" or "Review pending."
- Room bar at the bottom: every room always at hand, with the same flags.
- Priorities, at the end of the bar: the list of what needs attention, with a count.
- Map in the corner: a scaled-down floor plan to find any room in one click.
How to move around:
- Drag to rotate, scroll to zoom, use the right button to pan the camera.
- The buttons on the left zoom in, zoom out, show the building from above and reset the original framing.
- Rooms shows or hides the names over the rooms. Pause freezes the animation.
- On mobile, tap a room or desk, drag to rotate and use two fingers to zoom.
The same rooms, as cards
The List view is for people who prefer to keep it simple, or who are on mobile. Each card is a room, with what it covers, the reports it contains and the attention flag when there is one. The side panel shows the details of the selected room.
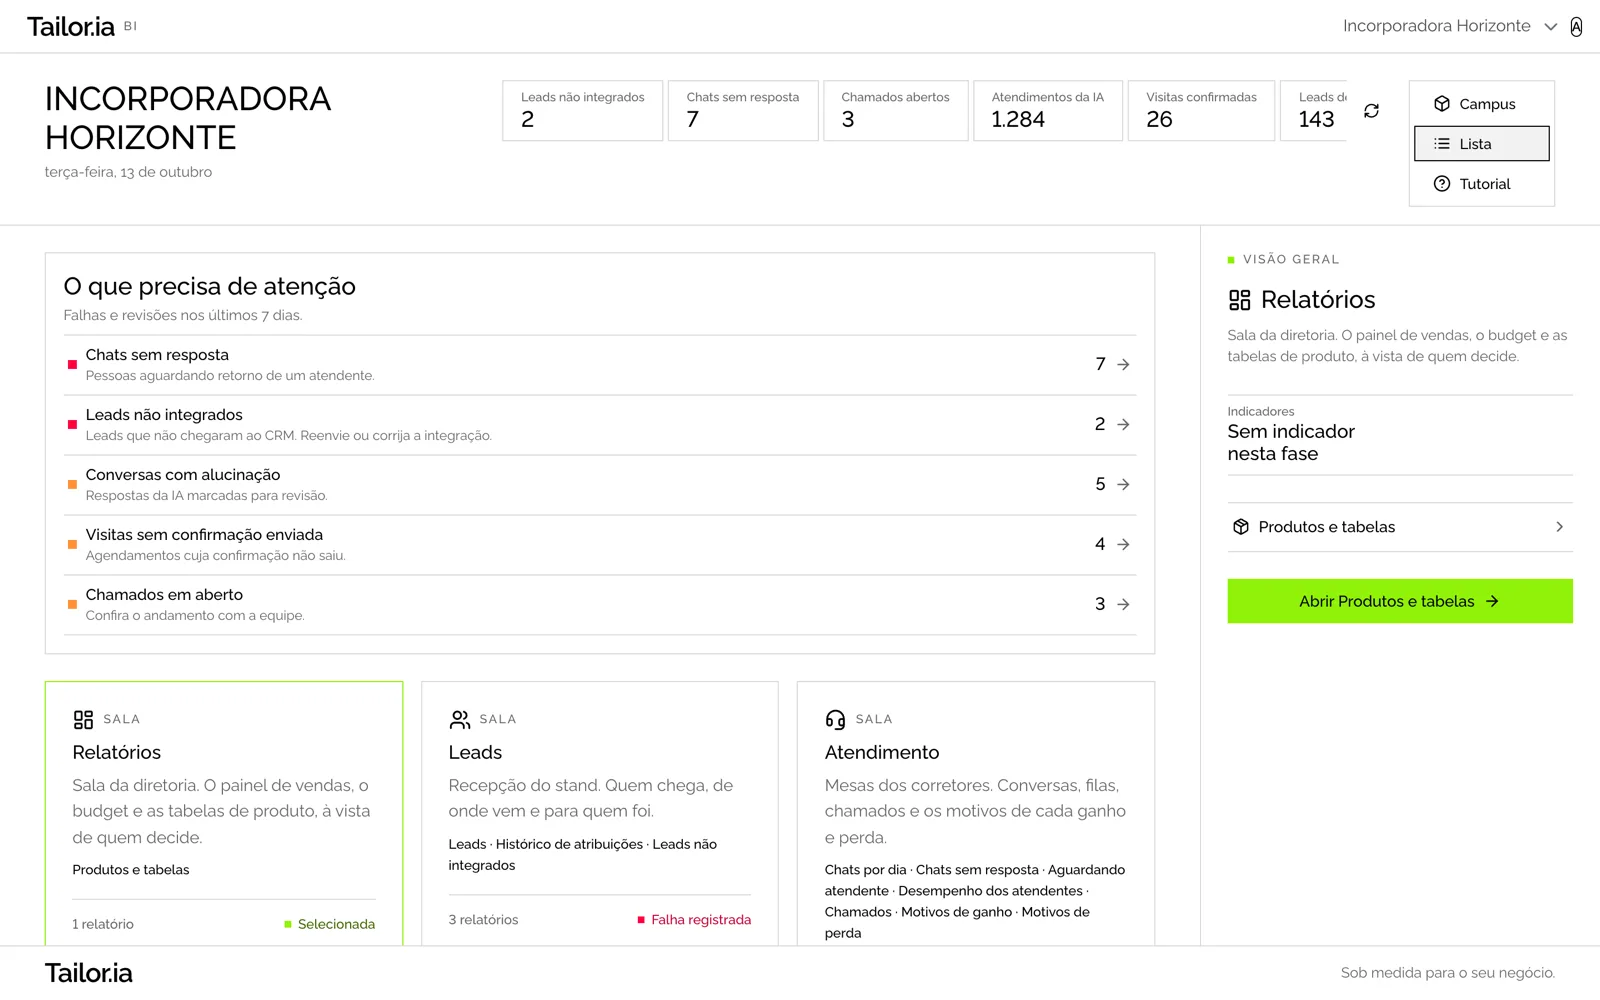
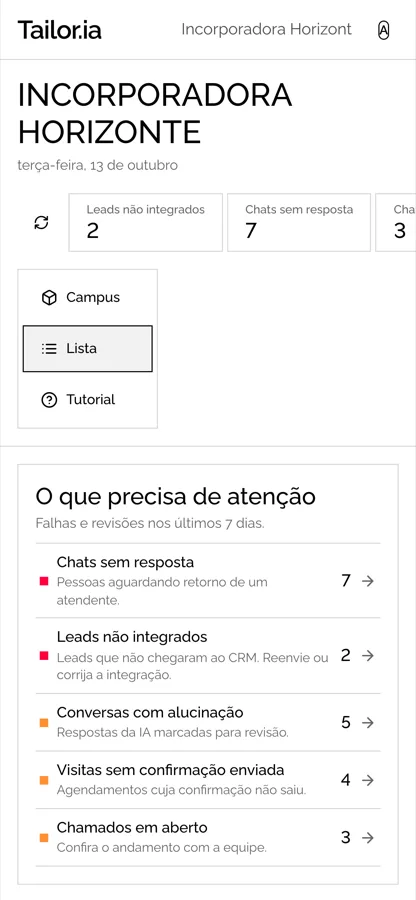
- The Campus and List buttons, in the top right corner, switch views. Your choice is saved for future visits.
- If your browser or device can't display 3D, List appears on its own. Nothing stops working.
The last 7 days in numbers, and what needs attention
At the top of the page are the week's indicators: leads not integrated, unanswered chats, open tickets, AI conversations, confirmed visits and campaign leads. Click any of them to open the matching report. The refresh button updates the numbers instantly.
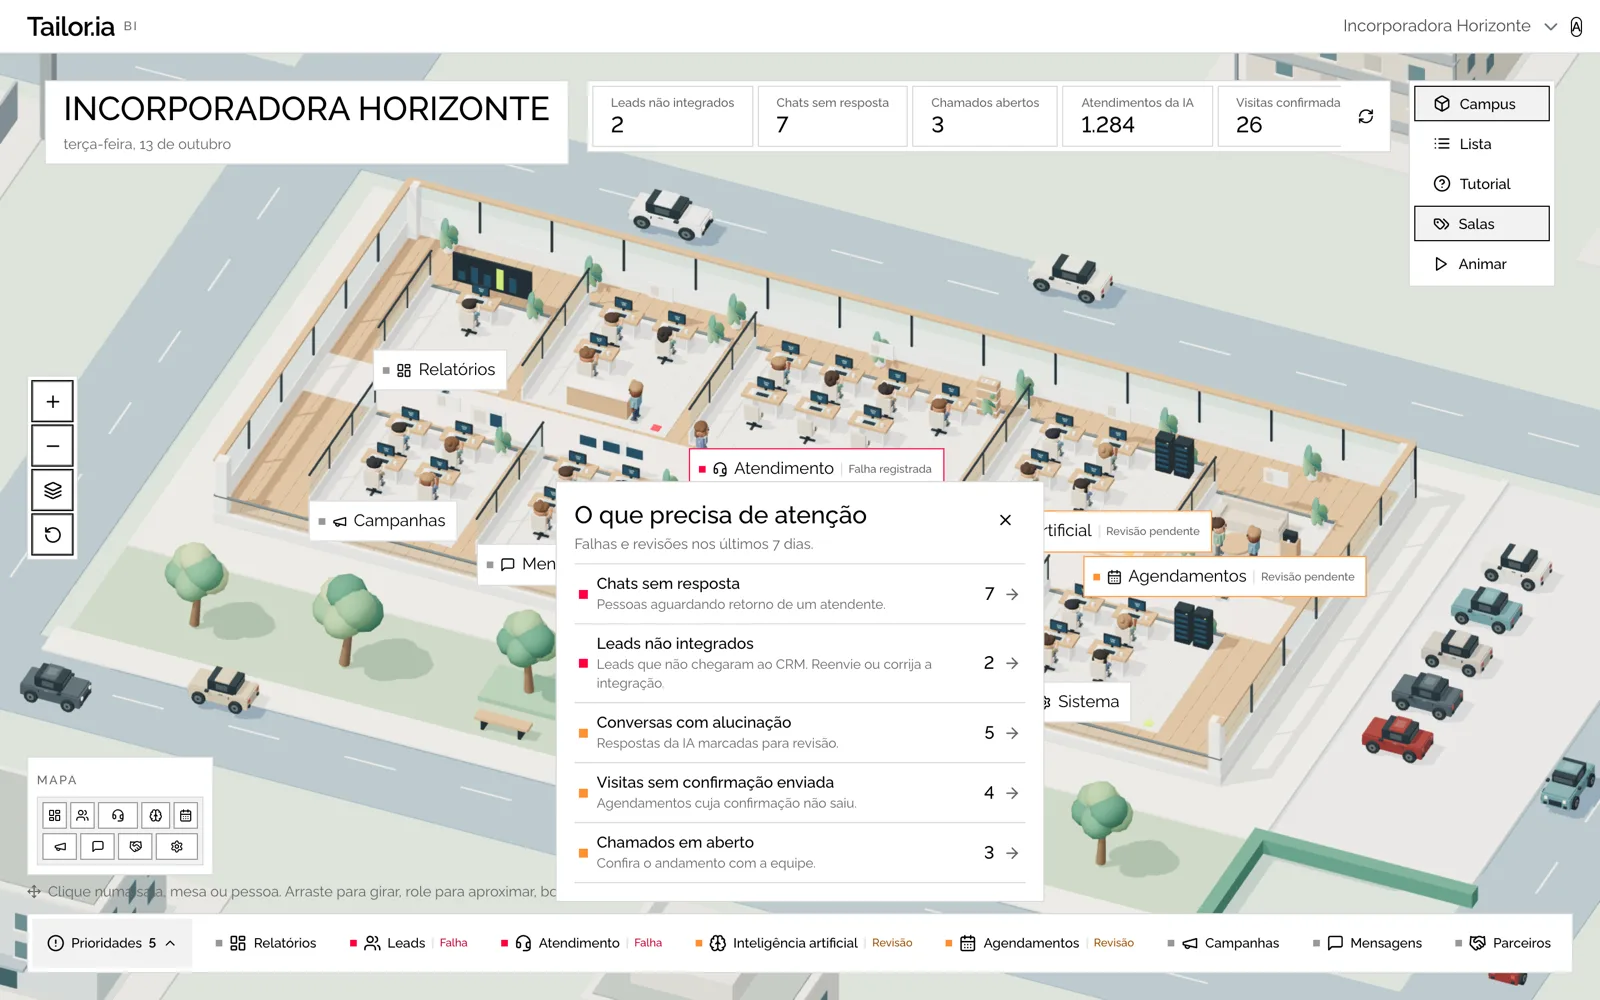
- Pending items such as unanswered chats, leads that never reached the CRM, AI conversations flagged for review, visits with no confirmation sent and open tickets show up in a single list, in order of urgency.
- Each room carries the same signal: "Failure logged" when something needs fixing, "Review pending" when something needs checking.
A guided tutorial, step by step
The first time you log in, a guide walks through every screen and control of the new panel, in both views, highlighting each element on screen. It's 17 steps and takes about two minutes. After that it won't appear on its own again: it lives in the Tutorial button, next to Campus and List, whenever you want to revisit it.
- Introduction: welcome, account and user, active account, 7-day indicators, Campus or List.
- List: rooms as cards, what needs attention, room details, opening a report.
- Campus: the 3D command center, room bar, priorities, camera, map, labels and animation, room details.
- Wrap-up: ready to go.
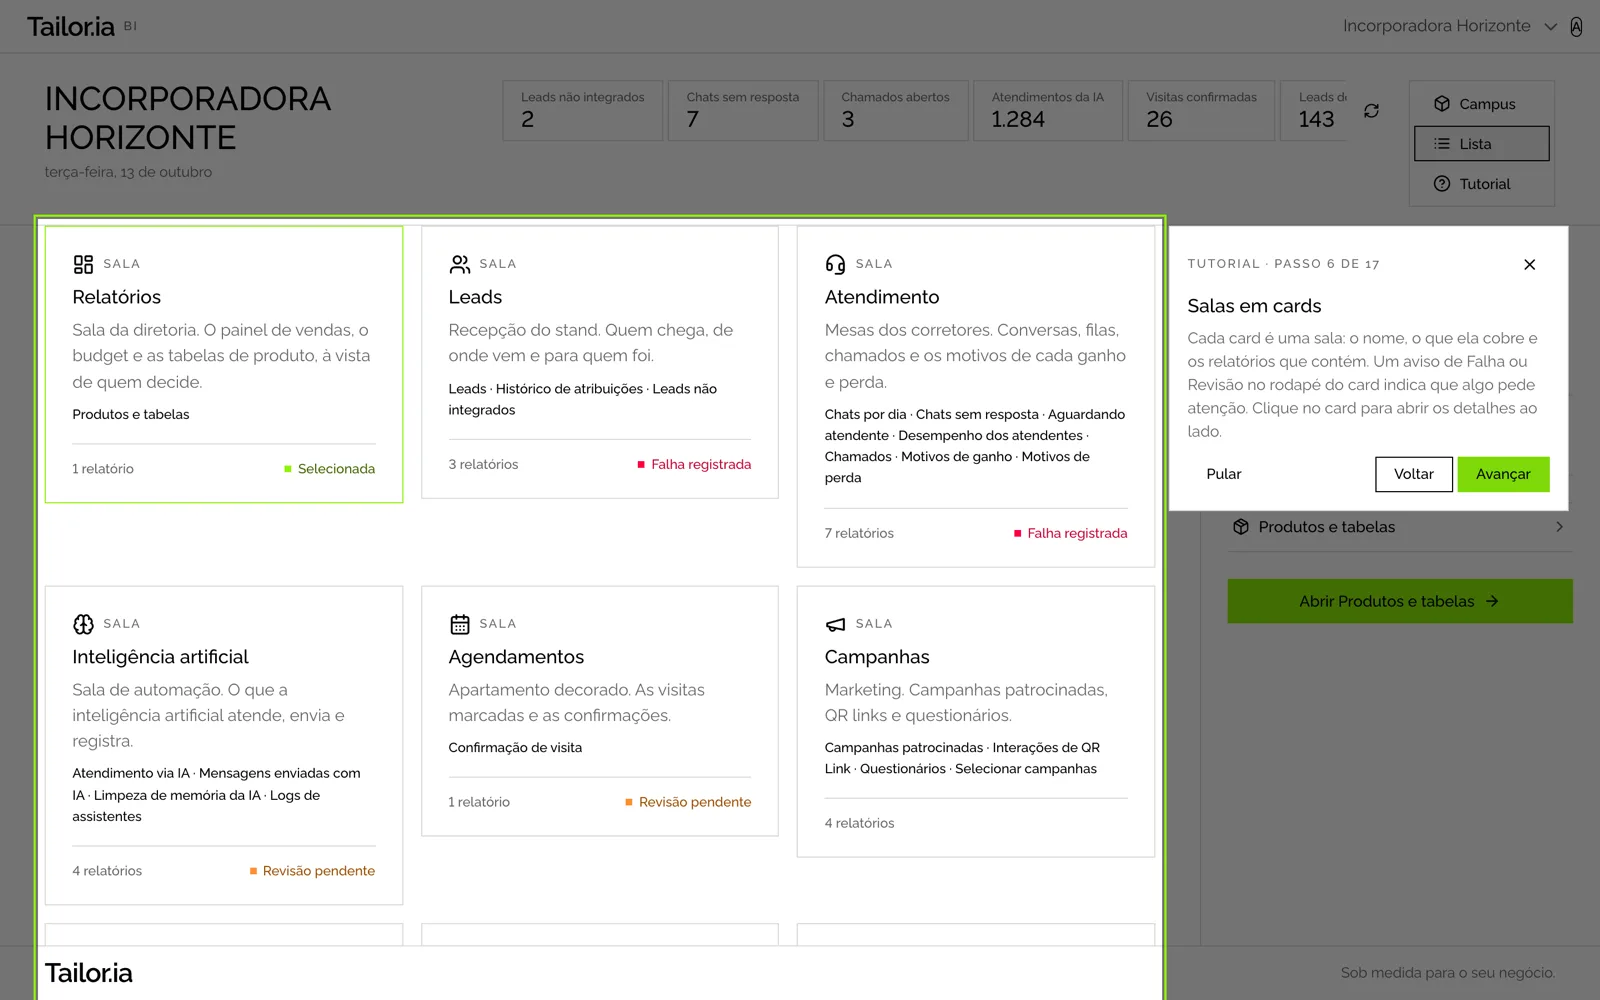
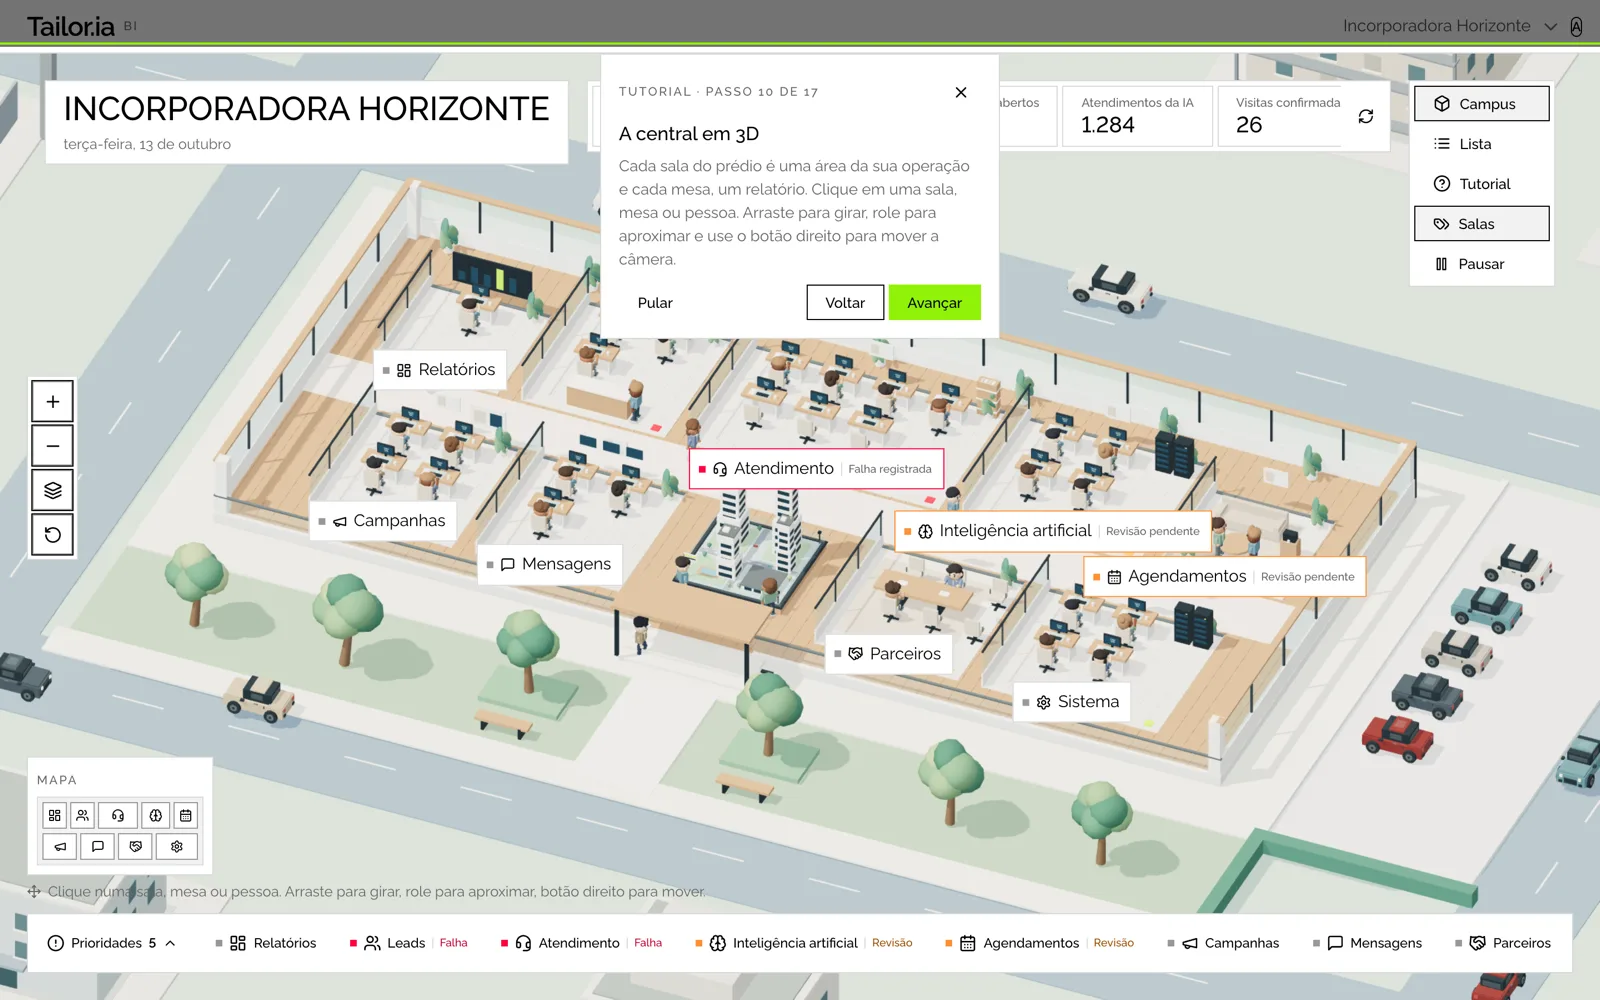
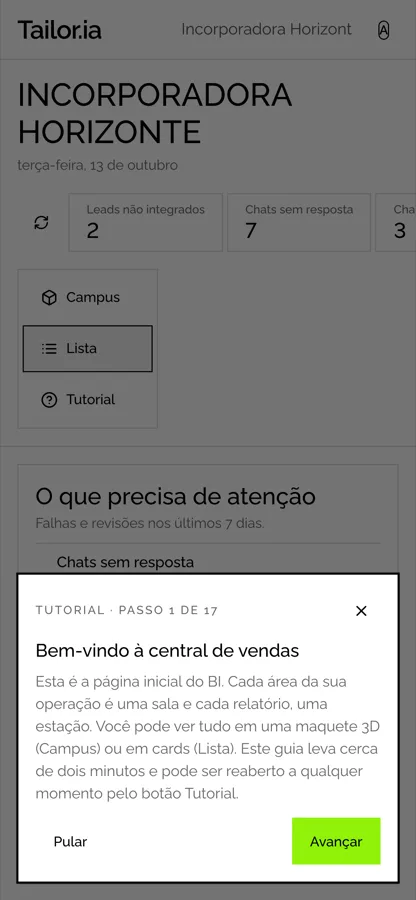
- Move forward and back with the buttons or the keyboard arrows. Esc closes it at any time.
- Skipping or finishing ends the guide. To see it again, click Tutorial.
Your reports, your access, your way of working
- The reports are the same as before, with the same filters and the same side menu. To return to the command center, click the logo at the top of the menu.
- Each person sees exactly the rooms and reports they already had access to. No permissions changed.
- Account switching, the assistant and your user menu remain at the top of the page.
- Dark theme, mobile and keyboard work in both views.
Get started
Log into BI with your usual access at bi.ffid.com.br, go through the tutorial once and pick the view you like best. If you have any questions or suggestions about the new panel, reach out to your contact at FFID.